
Metric Distribution
A Metric Distribution Report in a Risk Analyzer is a visual representation that provides insights into the distribution of specific metrics related to risk assessment. This report is a valuable tool for assessing and analyzing various aspects of risk within a project or organization.
Here's what a Metric Distribution Report typically displays:
Metric Breakdown: It visualizes the distribution of specific risk-related metrics, such as impact, probability, or severity. This distribution helps stakeholders understand the varying degrees of these metrics within the risk landscape.
Risk Categories: The report categorizes risks or issues into different groups or categories, often based on the specific metric being analyzed. This categorization allows for a more detailed examination of risk factors.
Visual Representation: Metric Distribution Reports are often presented in chart or graph form, making it easy to grasp the distribution of metrics and their implications at a glance.
Data Insights: By examining this report, users can gain insights into how specific metrics are distributed across different risk categories or issues. This aids in risk assessment, prioritization, and decision-making.
In summary, a Metric Distribution Report in a Risk Analyzer provides a visual breakdown of specific risk-related metrics and their distribution, helping stakeholders assess and manage risks more effectively. It offers a data-driven approach to understanding and acting on risk assessment metrics.
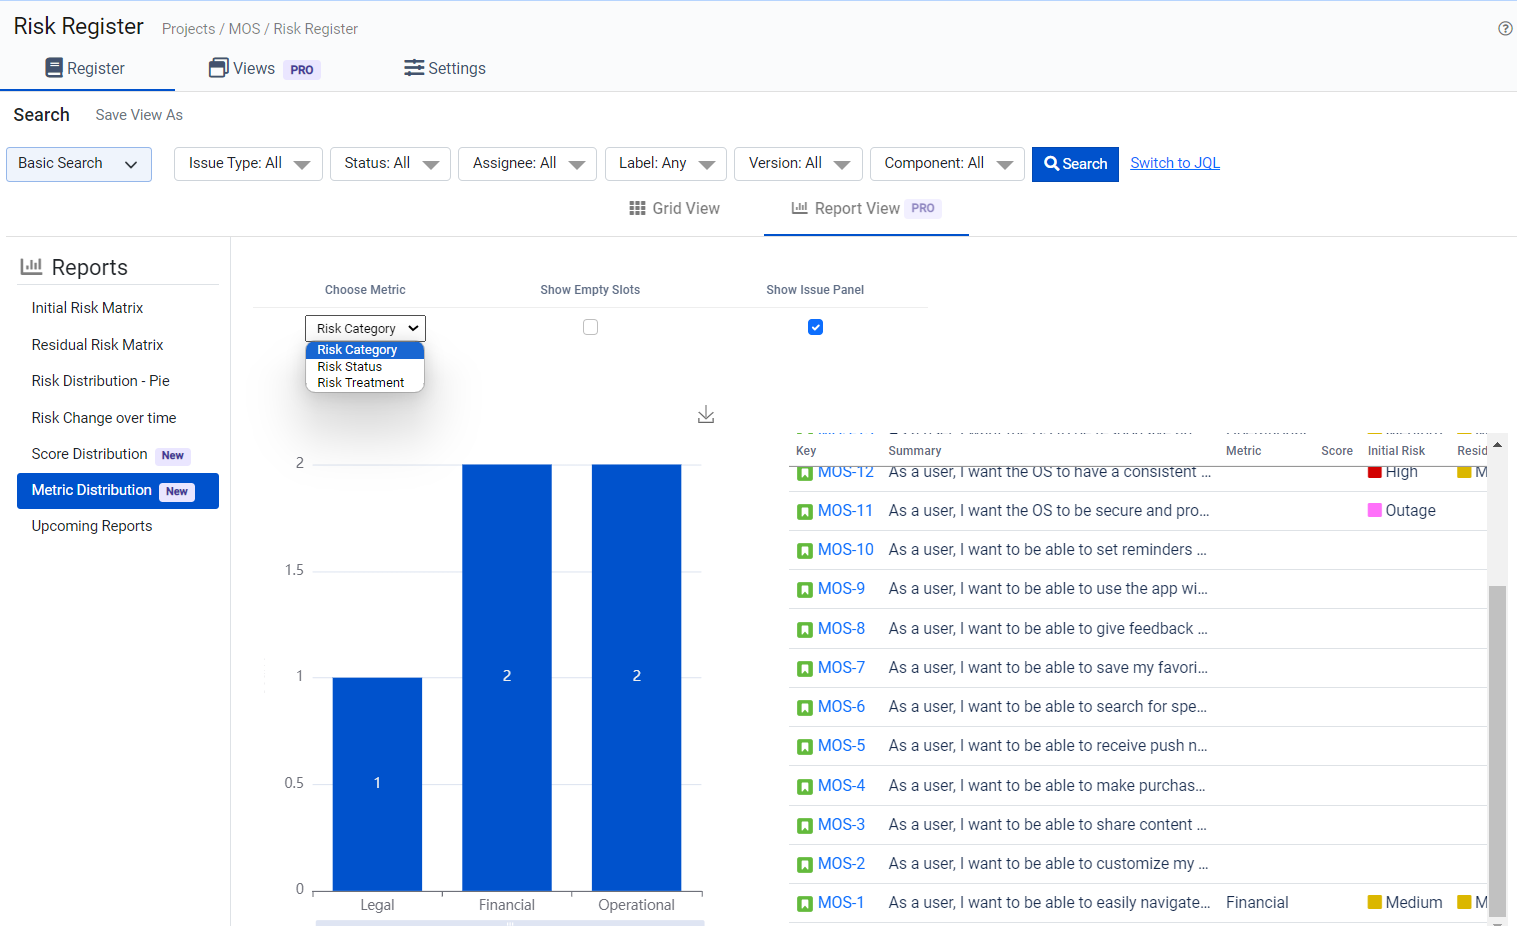
Here you can customize your report by choosing the different metrics.