
Score Distribution
A Score Distribution Report in a Risk Analyzer is a visual representation that provides insights into how risk scores are distributed across a set of risks or issues. This report is particularly useful in risk management and assessment processes.
Here's what a Score Distribution Report typically displays:
Risk Score Distribution: It visualizes the distribution of risk scores, which are typically based on criteria such as impact and probability. This distribution helps stakeholders understand the overall risk profile.
Risk Categories: The report categorizes risks or issues into different groups or categories, often based on their risk scores. This categorization allows for a more granular analysis of risks.
Visual Representation: Score Distribution Reports are often presented in chart or graph form, making it easy to grasp the distribution of risk scores at a glance.
Data Insights: By examining this report, users can gain insights into which risk categories or issues carry the highest or lowest risk scores, aiding in prioritization and decision-making.
In summary, a Score Distribution Report in a Risk Analyzer offers a visual breakdown of risk scores and their distribution, helping stakeholders make informed decisions about risk management and mitigation.
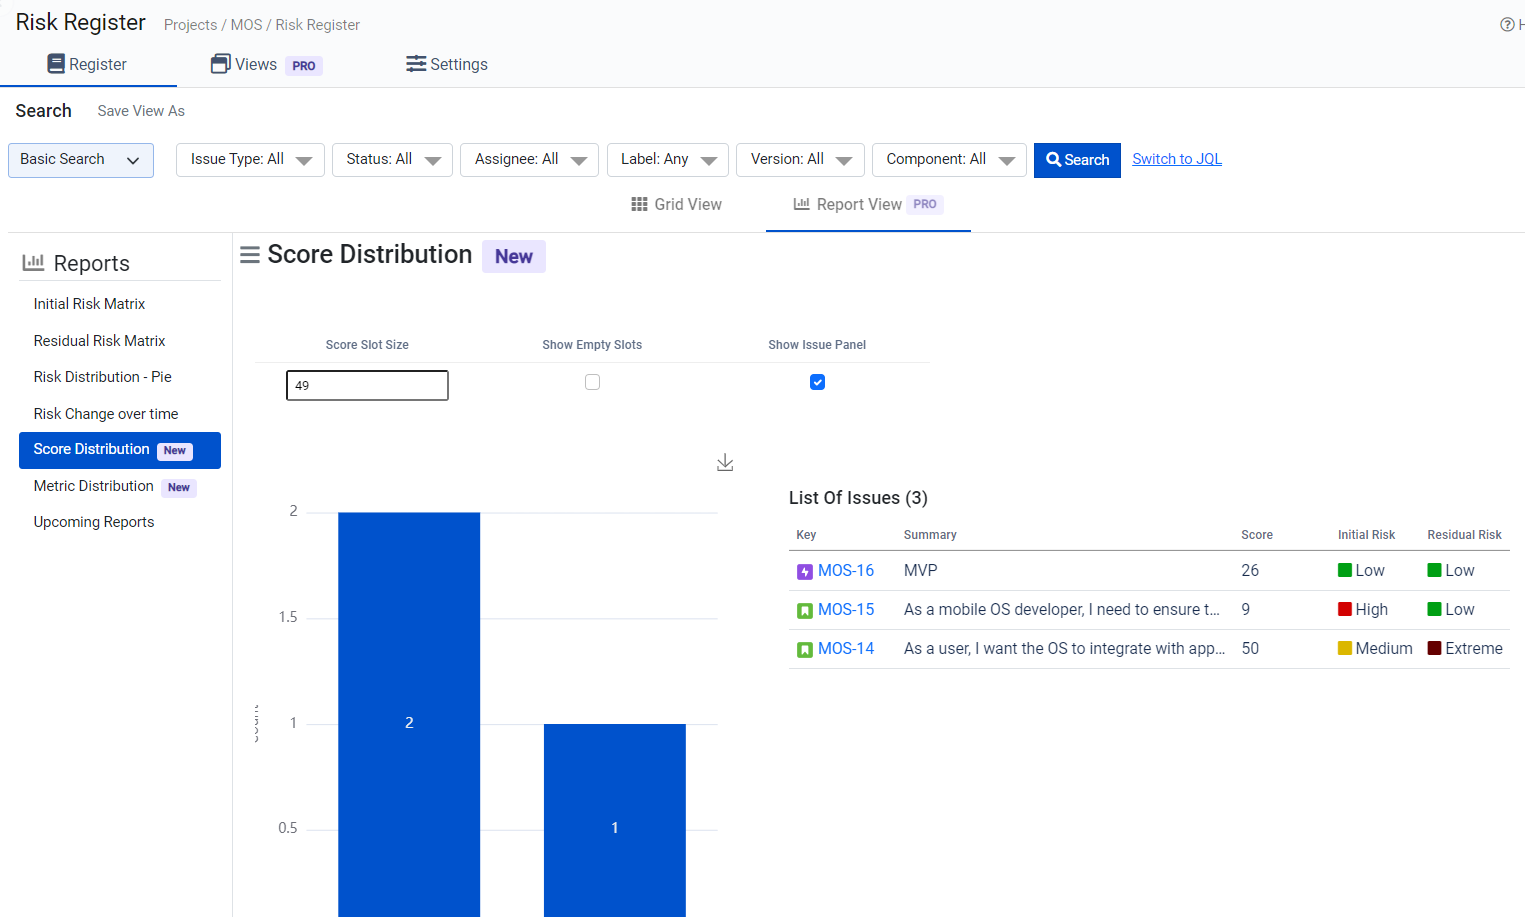
Here you can customize the report by editing the “score slot size”