Matrix Report
A matrix report in backlog prioritization is a comprehensive visual representation that combines multiple dimensions of data to offer insightful and informed perspectives on how backlog items are prioritized. It brings together various metrics, attributes, and criteria in a structured layout, allowing stakeholders to assess and understand the relative importance of different items within the backlog.
In essence, a matrix report presents a multidimensional view of your backlog data. Each axis of the matrix corresponds to a specific metric or attribute, and the intersection of these axes contains the calculated values or scores for each backlog item based on those metrics. This creates a grid-like display that enables you to quickly analyze and compare the prioritization of items from different angles.
Matrix reports are particularly valuable when dealing with complex projects or products where there are multiple factors to consider when deciding the order in which backlog items should be tackled. By visualizing this data in a matrix report, you can identify trends, correlations, and potential conflicts among various attributes, helping you make more informed decisions about which items to prioritize and why.
Ultimately, a matrix report in backlog prioritization serves as a powerful tool for enhancing transparency, collaboration, and strategic decision-making by presenting a holistic view of backlog items and their prioritization scores across a range of relevant criteria.
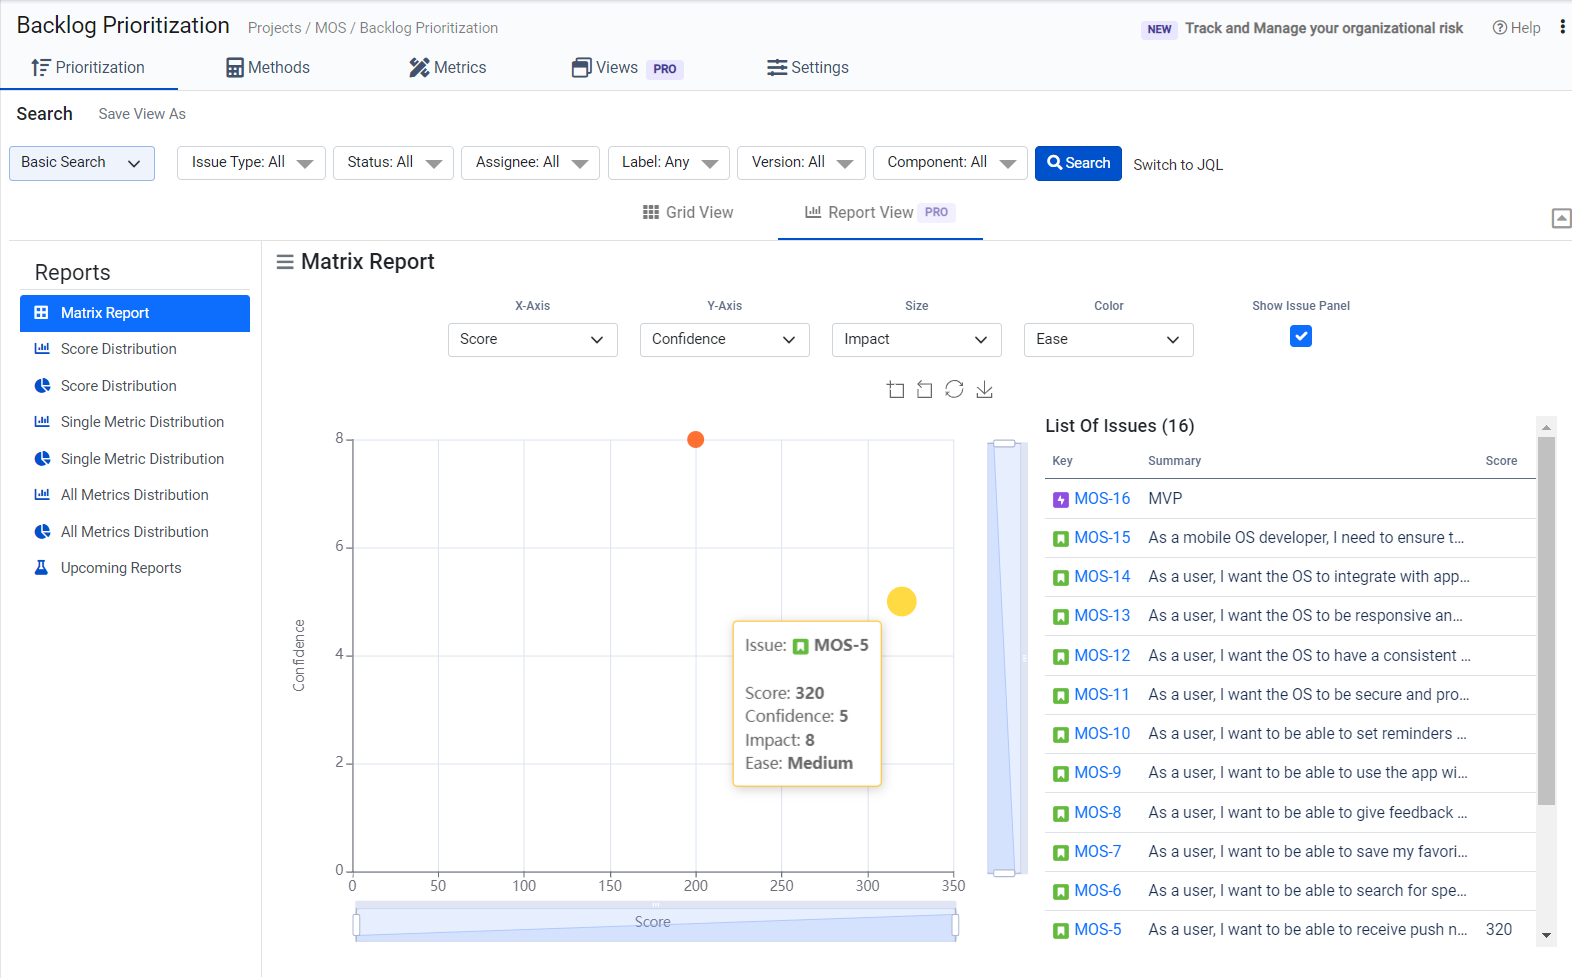
Below is an example of a matrix report with different metrics on each axis. You can easily change the metrics of the report according to your requirements.