Metric Distribution
A metric distribution report in backlog prioritization provides an overview of how different metrics are distributed across the items in a backlog. This report offers insights into how various attributes or criteria are distributed among the backlog items, helping you understand the composition and variations within the dataset.
In essence, the metric distribution report gives you a visual representation of how the values of specific metrics are spread across the backlog items. It can show you trends, concentrations, gaps, and outliers within the data, allowing you to make more informed decisions about prioritization and resource allocation.
Key points about a metric distribution report include:
Visualization: The report often employs graphical representations, such as histograms or box plots, to illustrate how the values of a particular metric are distributed among the backlog items.
Patterns and Trends: By examining the distribution, you can identify patterns, trends, and clusters that might influence your prioritization strategy. For example, you might notice that most items have similar values for a certain metric, or you might spot items with extreme values that need special attention.
Data Disparities: A metric distribution report can highlight disparities in your data, showcasing areas where there are notable differences in values, which might prompt further investigation.
Informed Decisions: Understanding metric distribution can guide decision-making. For instance, if a key metric is consistently low across items, it could suggest areas of improvement. On the other hand, if a metric shows a bimodal distribution, it might indicate the presence of distinct item categories.
Adjustments and Optimizations: If you're aiming for a more balanced distribution of metrics, this report can help you identify areas that require adjustments or optimizations.
In essence, a metric distribution report adds another layer of analysis to your backlog prioritization efforts, allowing you to explore and interpret the variations and trends in metric values. This knowledge can guide you in making strategic choices about how to allocate resources and which items to prioritize for maximum impact.
What Does the App offers?
Within the Backlog Prioritization app, you are presented with two distinct kinds of metric distribution reports: the Single Metric Distribution report and the All Metric Distribution report. These reports serve to provide insights into how metrics are distributed across your backlog items. You have the flexibility to visualize these reports in both graphical and pie chart formats, enhancing your ability to gain valuable insights from the data.
The Single Metric Distribution report offers a focused view of the distribution of a specific metric across your backlog items. This report allows you to delve into the distribution patterns of individual metrics, aiding you in understanding the variations and concentrations within the data.
The All Metric Distribution report, on the other hand, provides a broader perspective by showcasing the distribution of multiple metrics across the backlog items. This holistic view enables you to comprehend how different metrics interplay and how their values are distributed collectively.
Both types of reports, whether in graphical or pie chart form, empower you with a visual representation of metric distributions. These visualizations enable you to identify trends, outliers, and potential areas of focus, thereby contributing to informed decision-making in your backlog prioritization efforts.
Here are the images of the reports:
Single Metric Distribution:
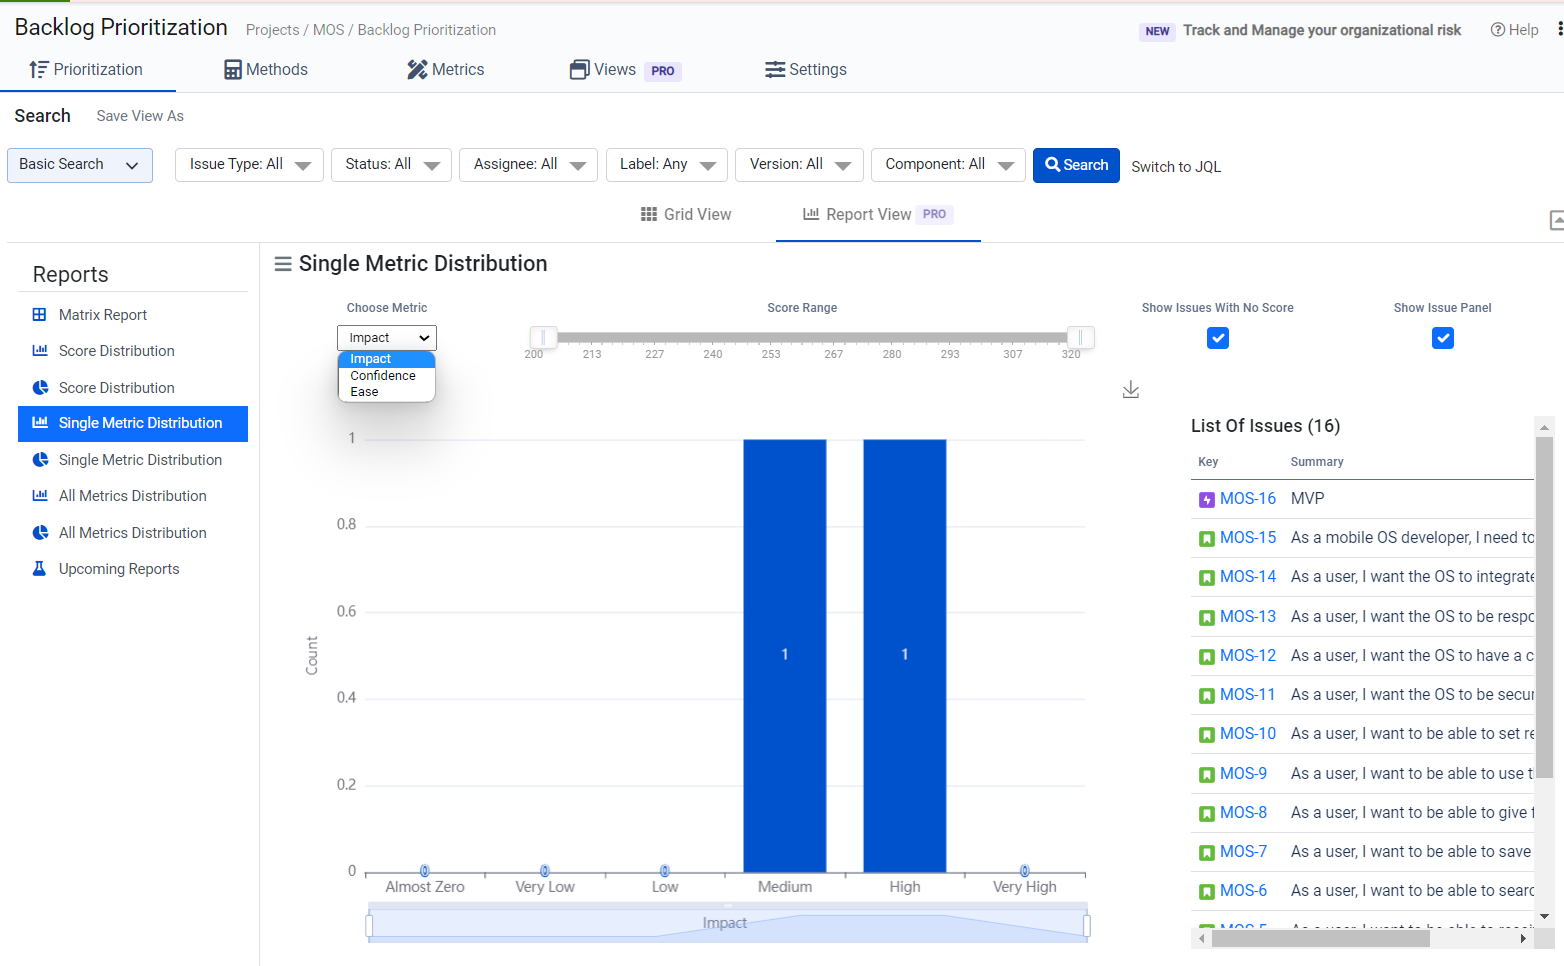
This is the graphical presentation of the report, you can view the pie chart representation also.
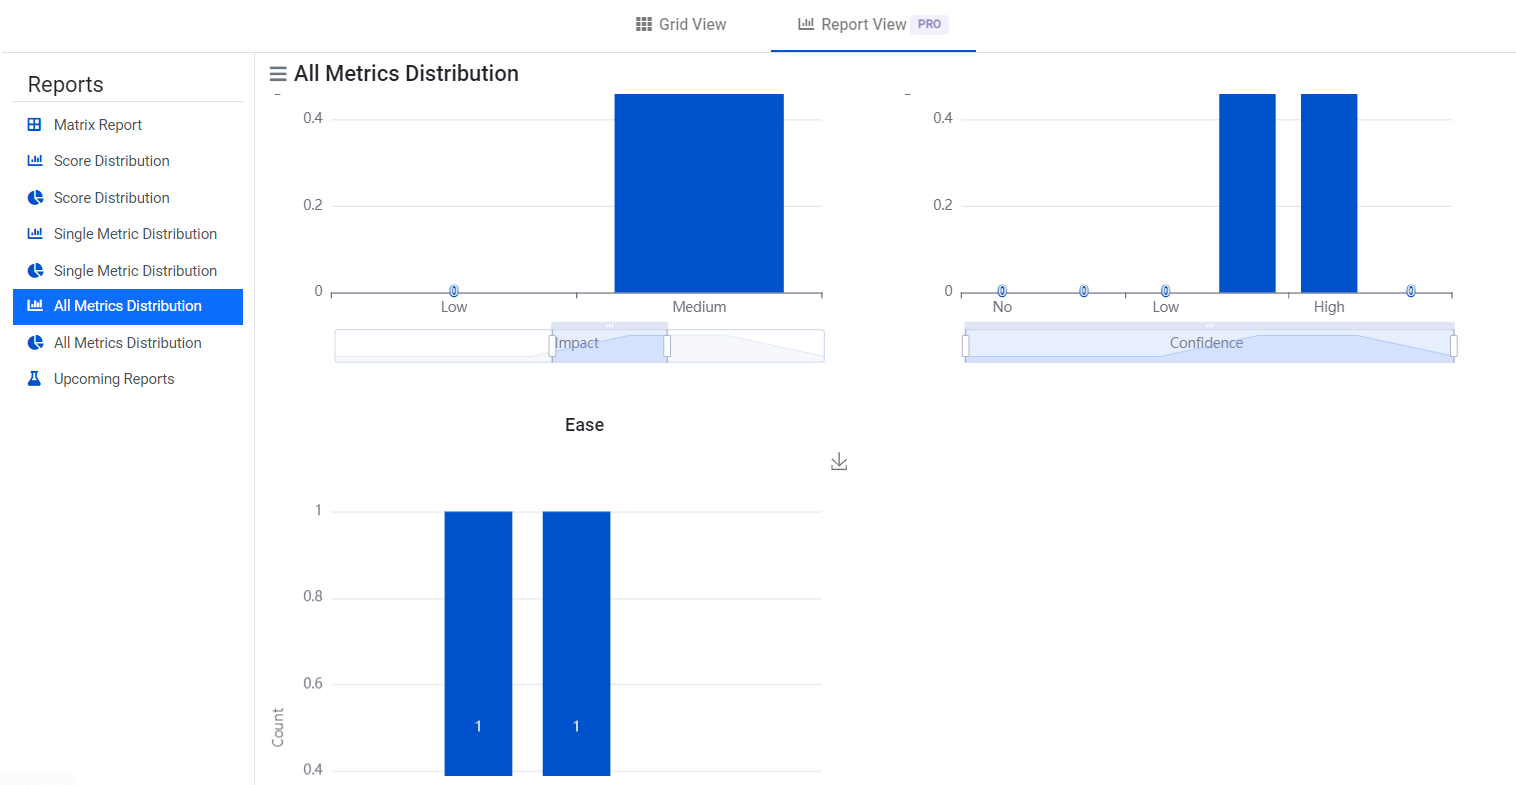
All metrics Distribution:
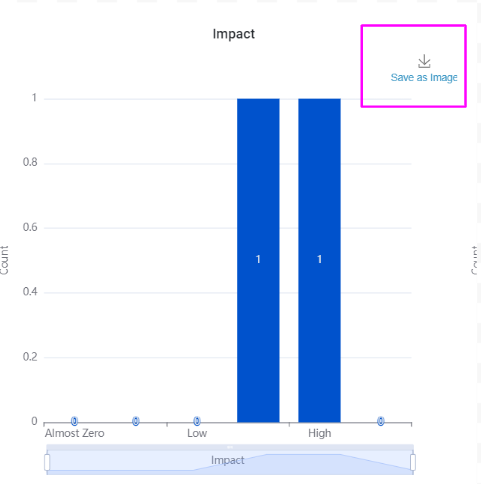
Note: You also have the ability to download these images by clicking on the download icon besides the graphs: