Metrics
What is a Metrics?
In backlog prioritization, metrics refers to a quantifiable measurement or data point used to evaluate and rank items in the backlog based on specific criteria. Metrics provide an objective and data-driven approach to prioritize items rather than relying solely on subjective opinions. They help teams make informed decisions and allocate resources effectively by considering various factors that contribute to the value and importance of each backlog item.
Common Metrics Used in Backlog Prioritization:
Reach: Reach refers to the number of people or users who will be affected by the project or task. This factor assesses the potential audience size or the extent of the impact the project can have on the target group. The larger the reach, the higher the priority of the item. Reach is typically measured in terms of the number of users, customers, or stakeholders who will directly benefit from the project's implementation
Return on Investment (ROI): ROI is a financial metric that compares the expected benefits or value of implementing a backlog item to the cost and effort required to develop it. Items with higher ROI are typically given higher priority.
Effort or Complexity: This metric measures the level of effort or technical complexity needed to complete each backlog item. Items that require less effort or are less complex may be prioritized higher as they can be delivered sooner.
Urgency: Urgency measures the time sensitivity of a backlog item. Some items might have deadlines, regulatory requirements, or dependencies that make them more urgent than others.
Customer Impact: This metric evaluates how each backlog item will directly affect end-users or customers. Items with a higher positive impact on users may be prioritized to enhance customer satisfaction.
Risk: Risk assessment considers potential uncertainties or negative consequences associated with implementing a backlog item. High-risk items may require more careful consideration and prioritization.
Cost of Delay: This metric calculates the cost associated with delaying the implementation of a particular backlog item. It helps teams understand the implications of postponing high-value items.
Confidence: Confidence reflects the level of certainty the team has in the estimates for reach and impact. It considers the amount and quality of available data and the team's expertise in making these estimates. A higher confidence level indicates that the team has more reliable data and insights, which increases confidence in the prioritization decision. In contrast, lower confidence might lead to more cautious prioritization or the need for further research and validation.
Customer Feedback: Feedback from customers or end-users can serve as a valuable metric to prioritize features or enhancements that align with their needs and preferences.
Business Value: This metric assesses the potential impact of each backlog item on the overall business goals and objectives. It considers factors like revenue generation, customer satisfaction, market share, and strategic alignment.
The choice of metrics will depend on the specific context of the project and the goals of the team. It is essential to select metrics that align with the project's objectives and provide meaningful insights into the value and impact of backlog items. Using a combination of metrics can lead to a well-balanced and data-driven backlog prioritization process.
Default Metrics
The Backlog Prioritization App offers a diverse range of pre-established metrics to aid in your prioritization process. However, you also have the flexibility to create custom metrics or leverage the existing ones. Here is the list of default metrics provided by the app.
Impact: Measure the potential influence of each backlog item on your project's success. Consider factors such as customer satisfaction, revenue generation, and strategic alignment.
Confidence: Evaluate the level of certainty in delivering a particular backlog item successfully. Assess factors like available resources, expertise, and past experience with similar tasks.
Ease: Analyze the simplicity or complexity of implementing each backlog item. Items that require minimal effort and resources may receive higher ease scores.
Effort: Assess the level of work required to complete a backlog item. This metric considers factors such as time, resources, and technical complexity.
Reach: Evaluate the extent to which each backlog item will benefit your user base or target audience. Consider the potential reach and impact on various user segments.
You can easily tailor your prioritization approach by utilizing these predefined metrics or creating new ones specific to your project's needs. The app empowers your team to make data-driven decisions, ensuring that your backlog is optimized to deliver the most valuable and impactful features first.
Adding a new Metrics
To enhance your customization options, you have the ability to introduce a novel metric tailored to your specific needs within the context of backlog prioritization. The process is simple and empowering:
Navigate to Metrics: Initiate the process by directing your attention to the Metrics tab within the backlog prioritization section.
Access Existing Metrics: Upon entering the Metrics tab, you will be presented with a list of metrics that are already in place, contributing to the prioritization framework.
Incorporate a Fresh Metric: To introduce a new metric, locate and engage the "Add Metric" option positioned conveniently at the upper right corner of the interface.
Define Metric Properties: As you embark on creating your distinctive metric, furnish it with a name that succinctly encapsulates its purpose. You also have the opportunity to define its type, offering you flexibility in aligning it with your prioritization objectives. Furthermore, providing a clear and concise description allows others to comprehend the metric's significance effortlessly.
Additional Insights: Utilize this opportunity to supply any supplementary information that might aid users in comprehending the metric’s nuances and its intended utilization.
Confirmation: Conclude the process by clicking the "OK" button, thus effecting the addition of your freshly minted metric to the existing lineup.
By following these steps, you can seamlessly incorporate your own metric, further enriching the spectrum of tools at your disposal for refining backlog prioritization strategies.

Update an existing Metrics
Metrics stand as the fundamental building blocks for the methodology's computation, serving as the bedrock upon which the ultimate score or method is formulated. This final score is meticulously derived by assimilating the values assigned to each issue metric.
While it remains a possibility to make adjustments to pre-existing metrics, such alterations should be executed with a sense of careful consideration. Here's the streamlined sequence to navigate this process:
Access the Metrics Hub: Initiate your journey by selecting the Metrics tab, a portal that opens up the realm of metrics management.
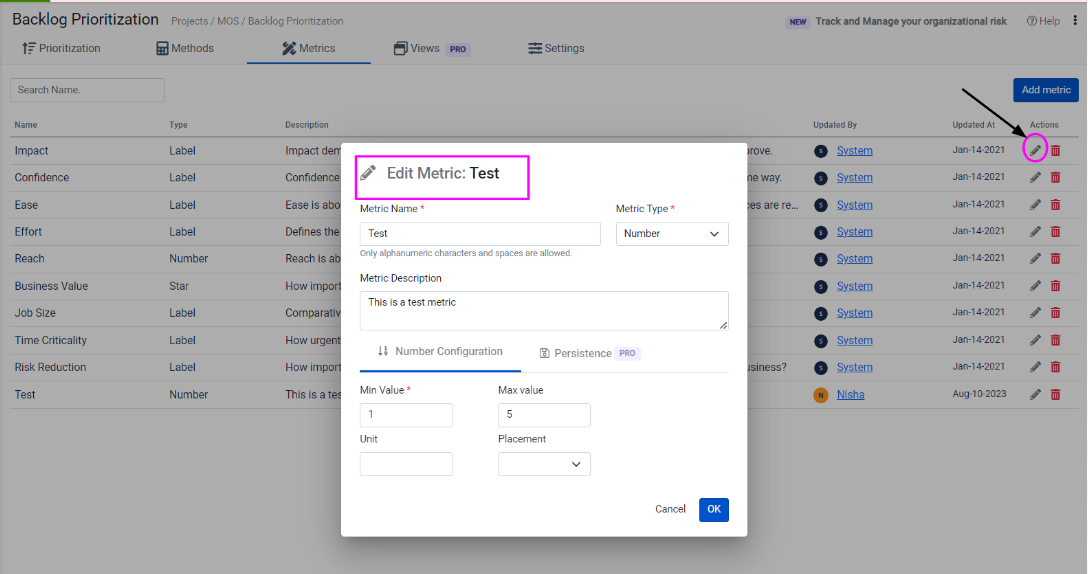
Edit Metrics: Within the Metrics tab, identify the metrics you intend to revise. This is accomplished by clicking on the pencil icon associated with the particular metric in question.
Holistic Attribute Modification: Upon entering the editing mode, you're granted the capability to make adjustments to various attributes, apart from the metric's name. Tailor the attributes as necessary to align them with your evolving requirements.
Preserve Changes: As you finalize your modifications, ensure to safeguard your adjustments by selecting the "Save" option, effectively enacting the updated metric.
Vital Consideration: It's important to take note that any modifications to the current range or values of a metric may trigger a notable impact. Specifically, issues currently reflecting values that lie beyond the revised range will manifest as errors on the grid. These errors, often indicating an out-of-range value, offer you the opportunity to rectify them.
As an illustrative scenario, imagine a metric named "Impact" initially spanning from 1 to 10. Post-update, this range is confined to 1 to 5. If a ticket previously bore a value of 7 for impact, it will be highlighted as an error on the grid, prompting you to amend this out-of-range value.
In essence, this process of metric refinement underscores the dynamism inherent in shaping your prioritization methodology while maintaining a vigilant eye on data integrity and consistency.
Note – Once added, a metric can be used to create a new method or can be used in an existing one.
Metrics Types
Metrics synergistically converge to compose a method that fuels the prioritization engine. Whether through the grid view or the issue view, you hold the authority to fine-tune metrics, setting in motion an automatic recalculation of the issue score. Within this spectrum, a diverse array of metric types resides, each lending itself to proffering values of distinct natures. Notably, regardless of the metric type's inherent characteristics, its ultimate function culminates in delivering a numerical value, which serves as the cornerstone for the intricate choreography of score computation. Below are the metric Types:
Number

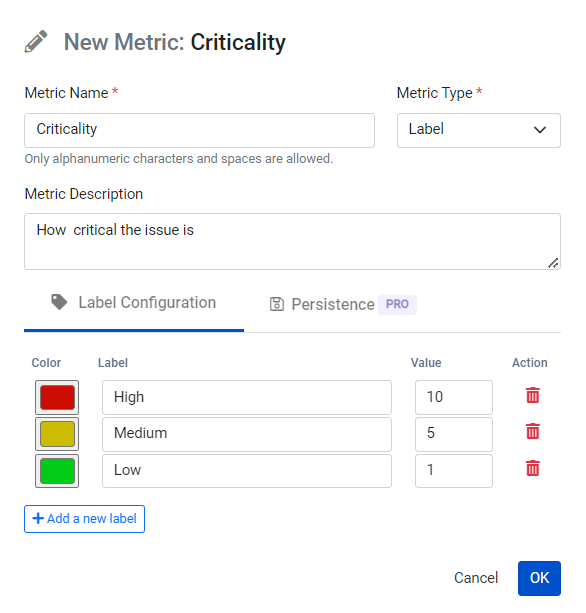
Label
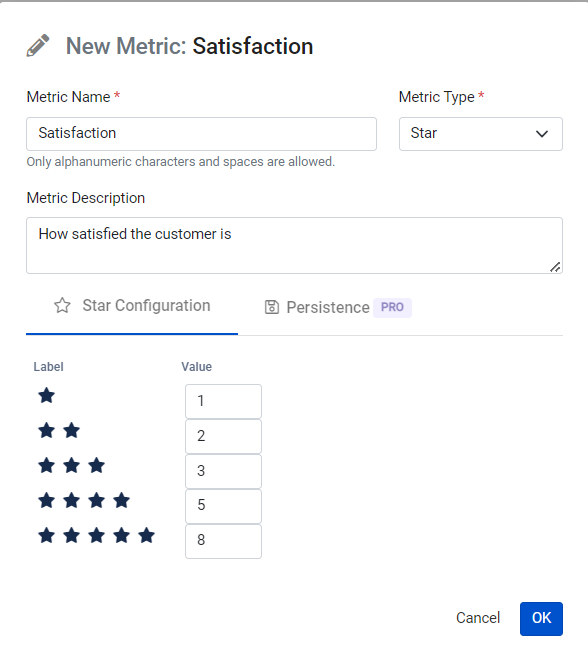
Star
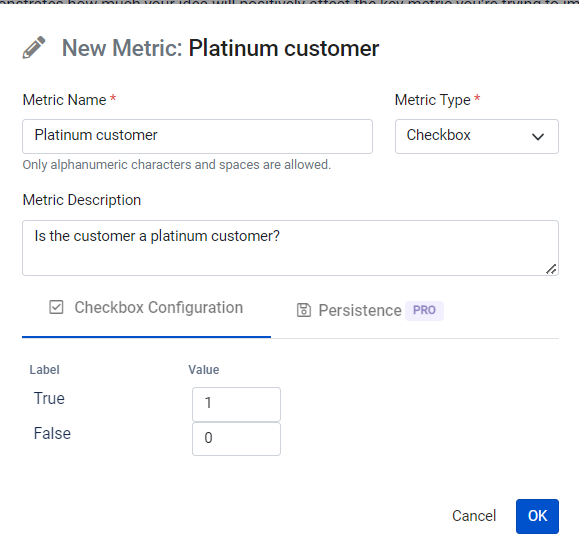
Checkbox