Score Distribution
Score distribution in backlog prioritization refers to the pattern or spread of scores assigned to different items within a backlog. It represents how the prioritization scores are distributed across various backlog items based on the defined criteria or metrics.
When you assign scores or values to different attributes or metrics for each backlog item, you create a ranking that indicates the relative importance or priority of each item. Score distribution provides insights into the diversity of prioritization across the backlog, highlighting which items are considered high-priority, mid-priority, or low-priority based on the assigned scores.
Analyzing score distribution can reveal several important aspects:
Balancing Priorities: A well-distributed score range indicates that priorities are balanced across different items. This suggests that a mix of high-priority and lower-priority tasks are being addressed, allowing for a holistic approach to development or project execution.
Highly Prioritized Items: A skewed distribution with a cluster of high scores indicates that certain items are significantly more important or urgent than others. This might prompt further examination to ensure that these highly prioritized items align with project goals.
Potential Overlooked Items: On the other hand, if there's an extensive range of scores but no items with very high or very low scores, it could imply that no particular item is being given extreme priority or that certain items are being overlooked.
Resource Allocation: Score distribution can also guide resource allocation. For example, if most high-priority items have similar scores, it suggests that they're equally important, helping teams allocate resources more effectively.
Identifying Discrepancies: A sudden shift or irregularities in the score distribution might indicate changes in project goals, shifts in market demands, or new insights that warrant attention.
Understanding score distribution aids teams and stakeholders in comprehending the composition of the backlog in terms of priority. It assists in making informed decisions about which items should receive immediate attention, ensuring that the backlog is managed efficiently and aligns with the overarching project objectives.
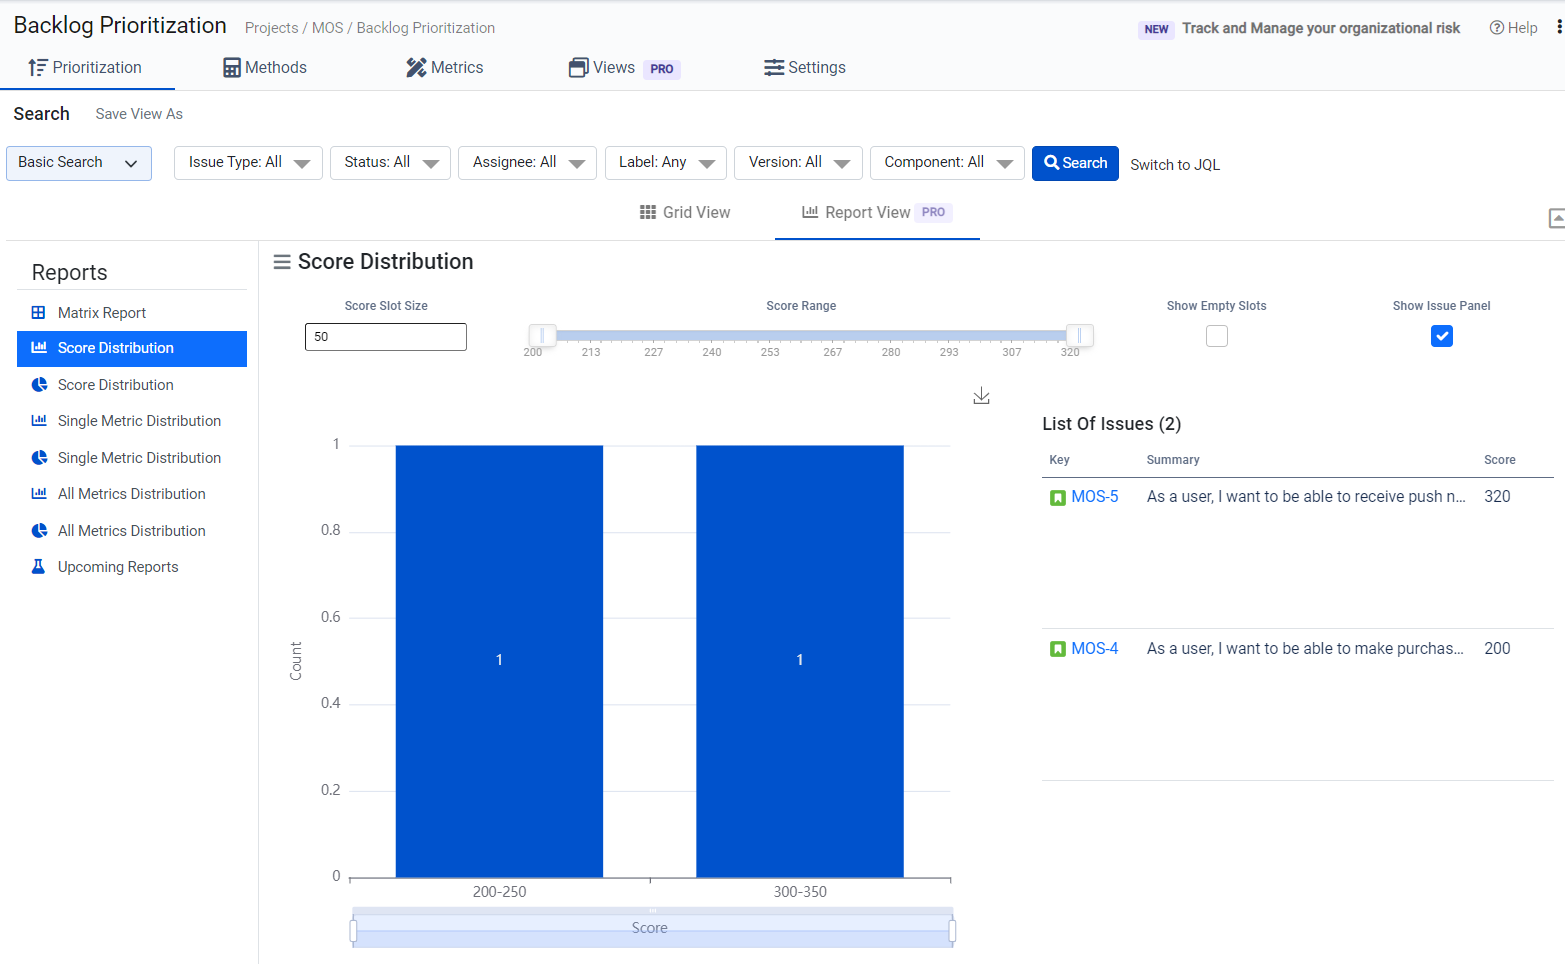
Within the Backlog Prioritization application, there exist two distinct categories of score distribution reports: the Graphical view and the Pie Chart representation. These reports offer insightful depictions of how scores are distributed among your backlog items. Tailoring these reports to match your requirements is made possible through adjustments to the "score slot size" and "score range" parameters. Furthermore, a selection of supplementary filter options is readily available, enhancing your ability to refine and shape the report precisely as needed, as illustrated in the below-accompanying images.