BPN Grid Export as CSV
1. Ability to Export.
The latest update to the backlog prioritization app introduces a significant enhancement: the ability to export the grid view of the data. This means that users can now easily save and transfer the structured layout of their backlog, including all the information and prioritization they see on their screens. This feature offers greater flexibility and convenience for users who may need to share or archive their backlog data outside of the app environment. Whether it's for collaborative purposes, reporting, or simply for record-keeping, this export functionality expands the utility of the app and streamlines workflow processes for teams managing their backlogs.
Note:
The downloaded report will be in a CSV format.
2. How to Export?
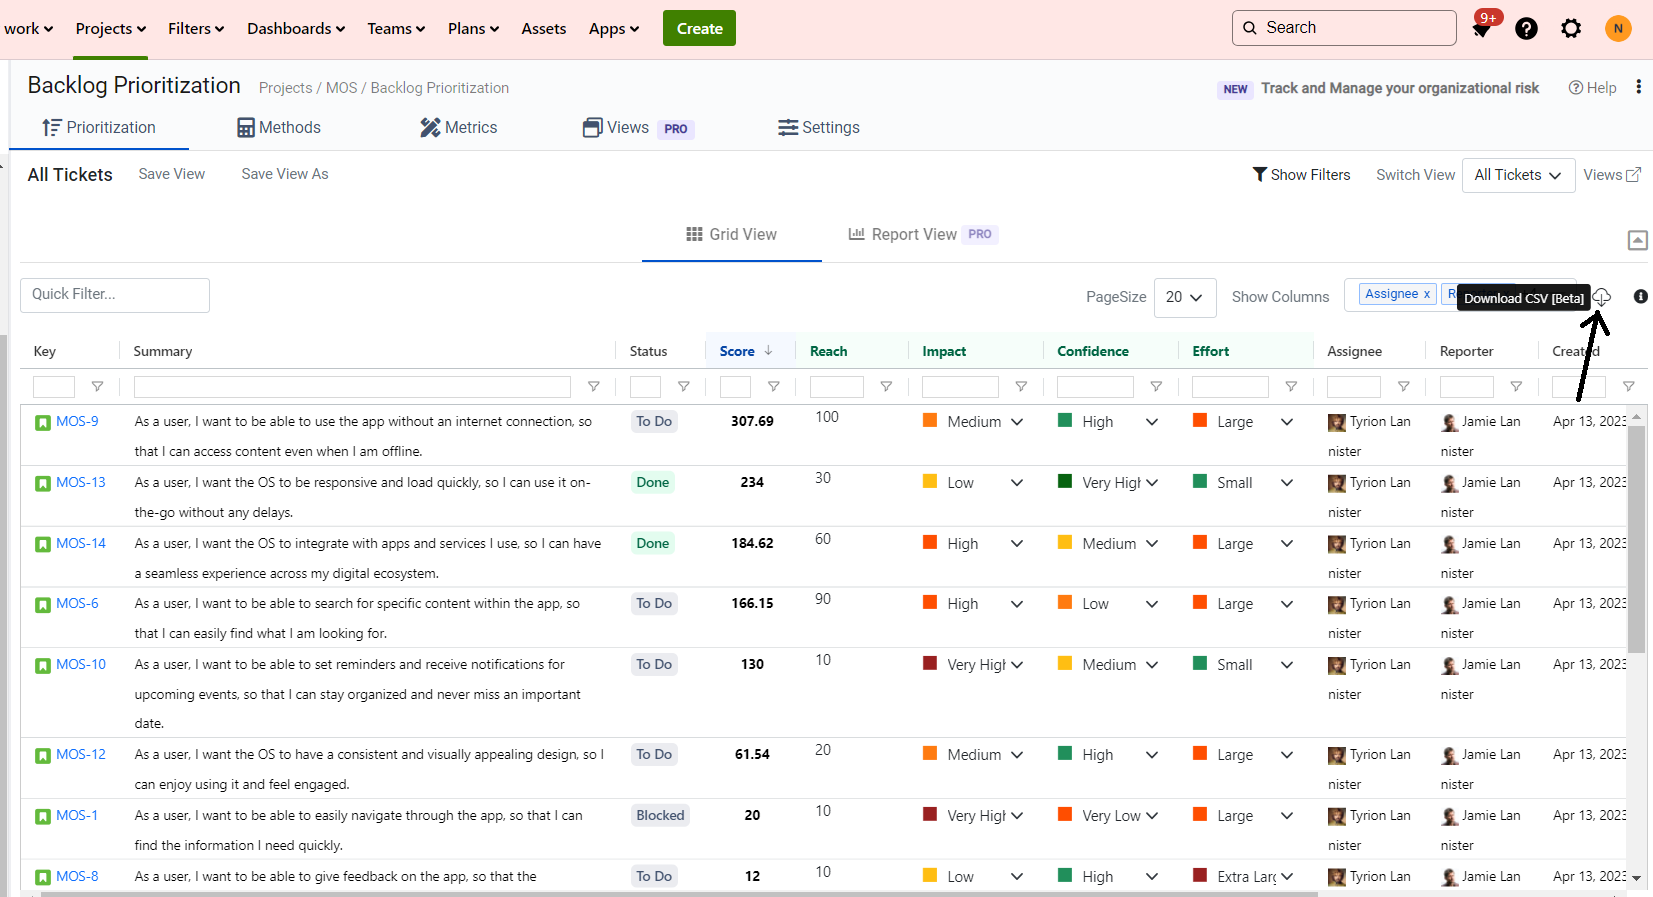
Accessing the grid view download feature in the backlog prioritization app is straightforward. Simply navigate to the report you wish to download and locate the download icon positioned at the top right corner of the screen. This icon typically resembles a cloud with an arrow. Clicking on this icon initiates the download process, allowing you to save the grid view of the report directly to your device. This intuitive functionality enhances user experience by providing a quick and convenient method to export data for further analysis, sharing with stakeholders, or archival purposes. Please refer to the below screenshot:
3. Exporting Custom Jira Fields
In the latest update of our backlog prioritization app, we've introduced a feature that allows users to export custom Jira fields along with their backlog data. This means you can now include additional fields beyond the standard ones in the grid view and export them seamlessly.
To utilize this feature, first, navigate to the settings or customization options within the app. Here, you'll find the option to add custom Jira fields to your grid view. These custom fields could be specific to your project's needs, such as "Estimated Time to Complete," "Customer Impact," or any other relevant metrics you track within Jira.
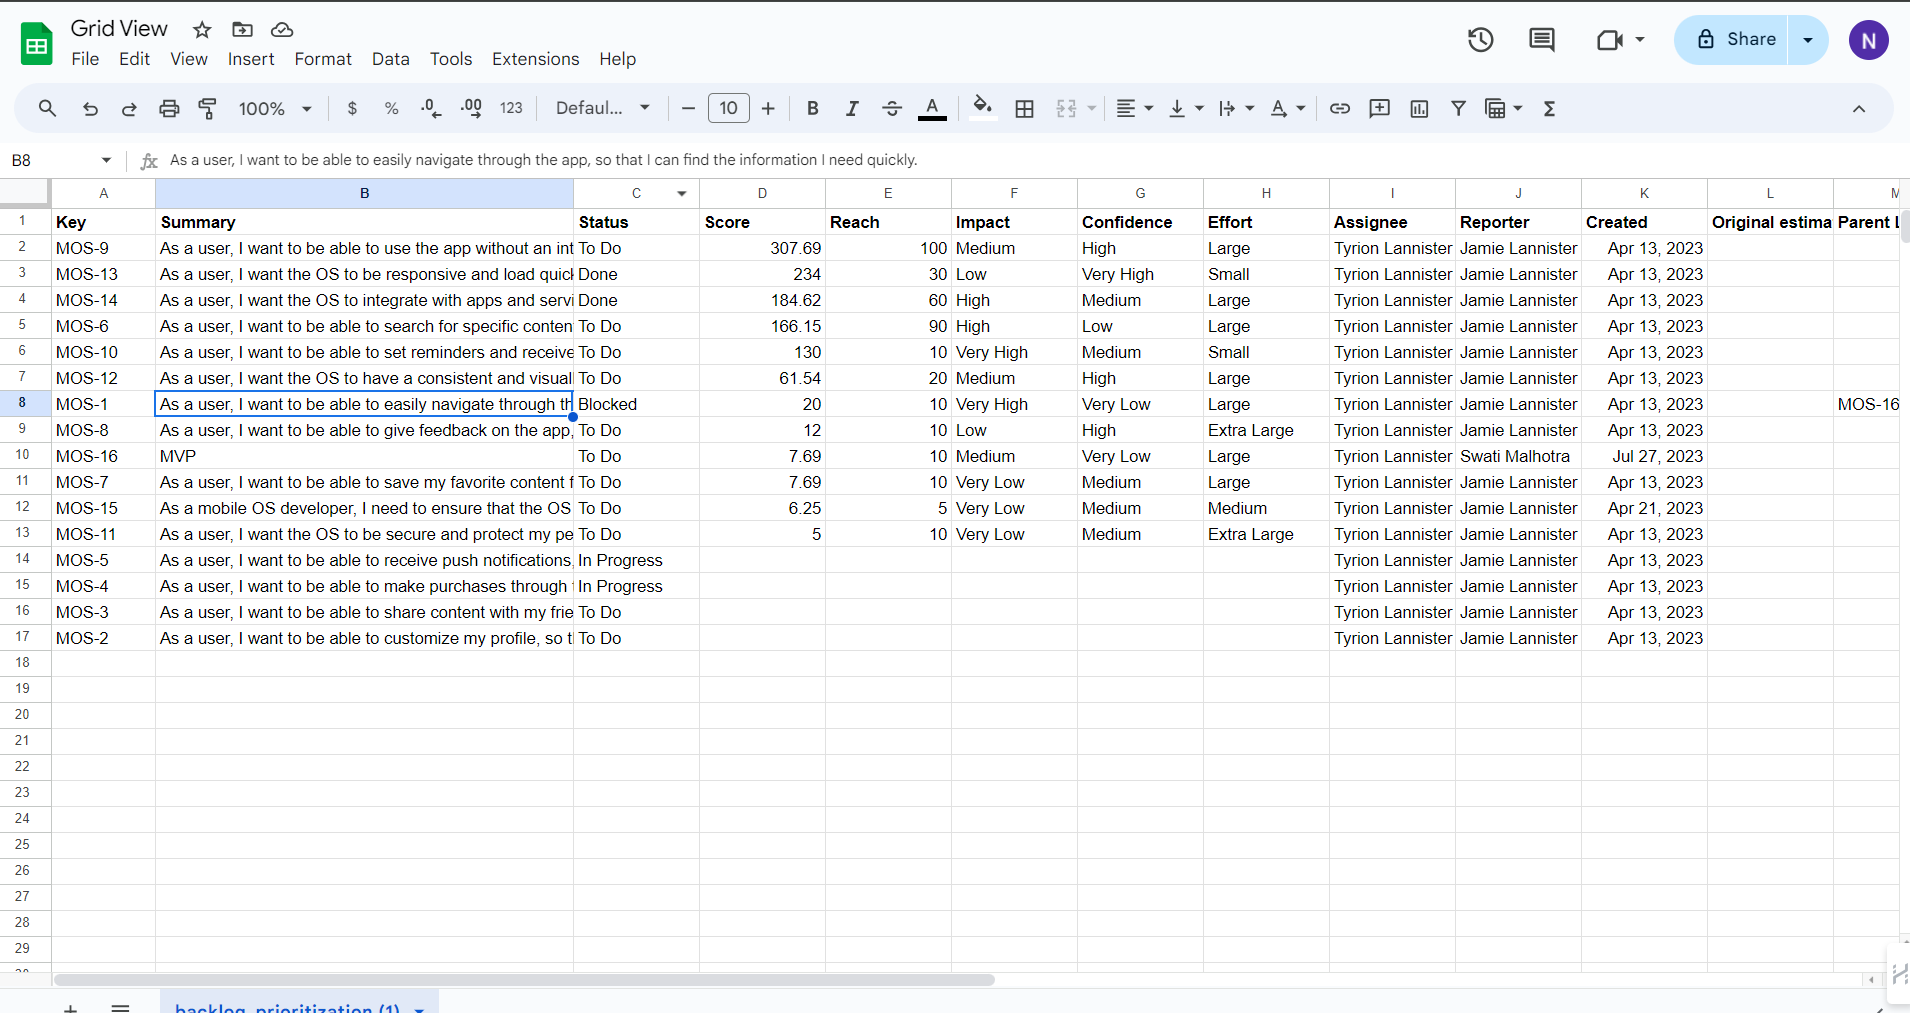
Once you've added these custom fields to your grid view, you can proceed to export them along with the rest of your backlog data.
Here is the picture of how your report will look like once you export it: