
Dashboard gadget
The app ships a Jira dashboard gadget, so test health can sit on the dashboard a team already looks at.
Add it
Section titled “Add it”- Open a Jira dashboard and choose Add gadget.
- Pick Advanced Test Management from the list.
- Choose the project it should report on, and the report it should show.
- Save.
A dashboard has no project of its own, which is why the gadget asks for one. Add the gadget more than once to watch several projects, or several reports on the same project, side by side.
What it can show
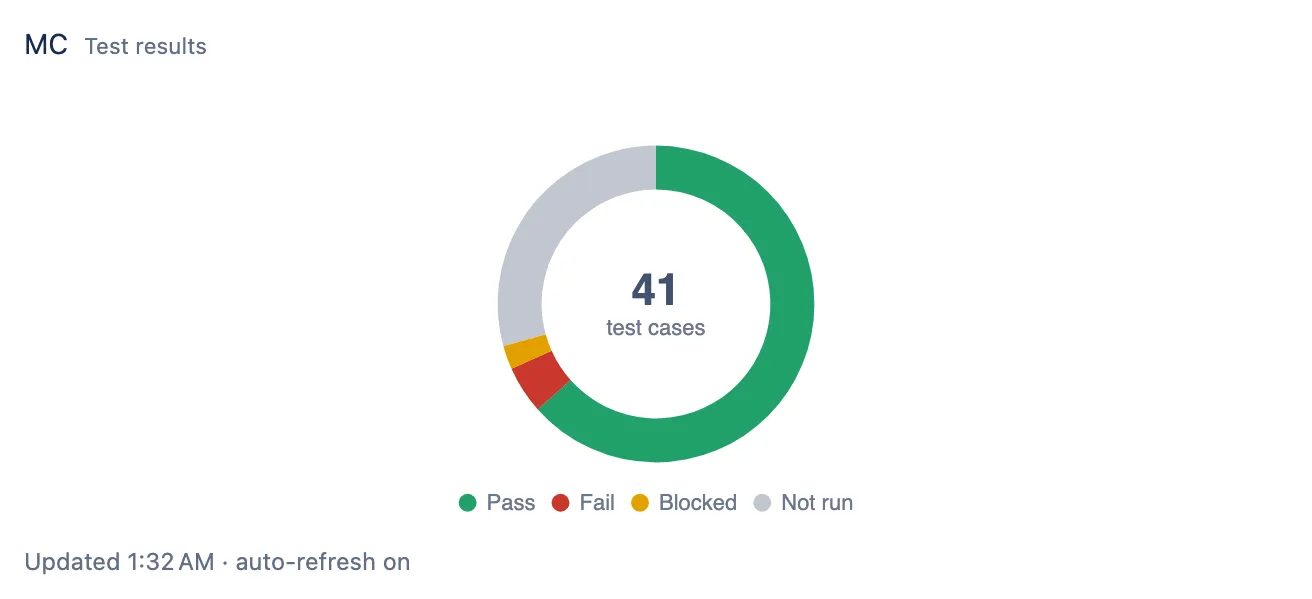
Section titled “What it can show”Summary is the default and needs no setting up. Beyond it, most of the Reports tab is available: test results, requirement coverage, failing and at-risk, test inventory, automation coverage, Test Set health, coverage gaps, coverage by grouping, defects, execution trend, results by executor and plan execution summary. A burndown also asks which plan to track.
Reports with options keep them here too, so the same report can appear twice on one dashboard with a different grouping or chart in each. The editor explains what the chosen report means before you save it, in the same words the app uses elsewhere.
Auto-refresh every 15 minutes is off by default. Leave it off for the heavier reports: the editor marks the ones that read every execution, and a dashboard loads them again for every person who opens it.